Sketchart Is The New Way To Document Software Architecture
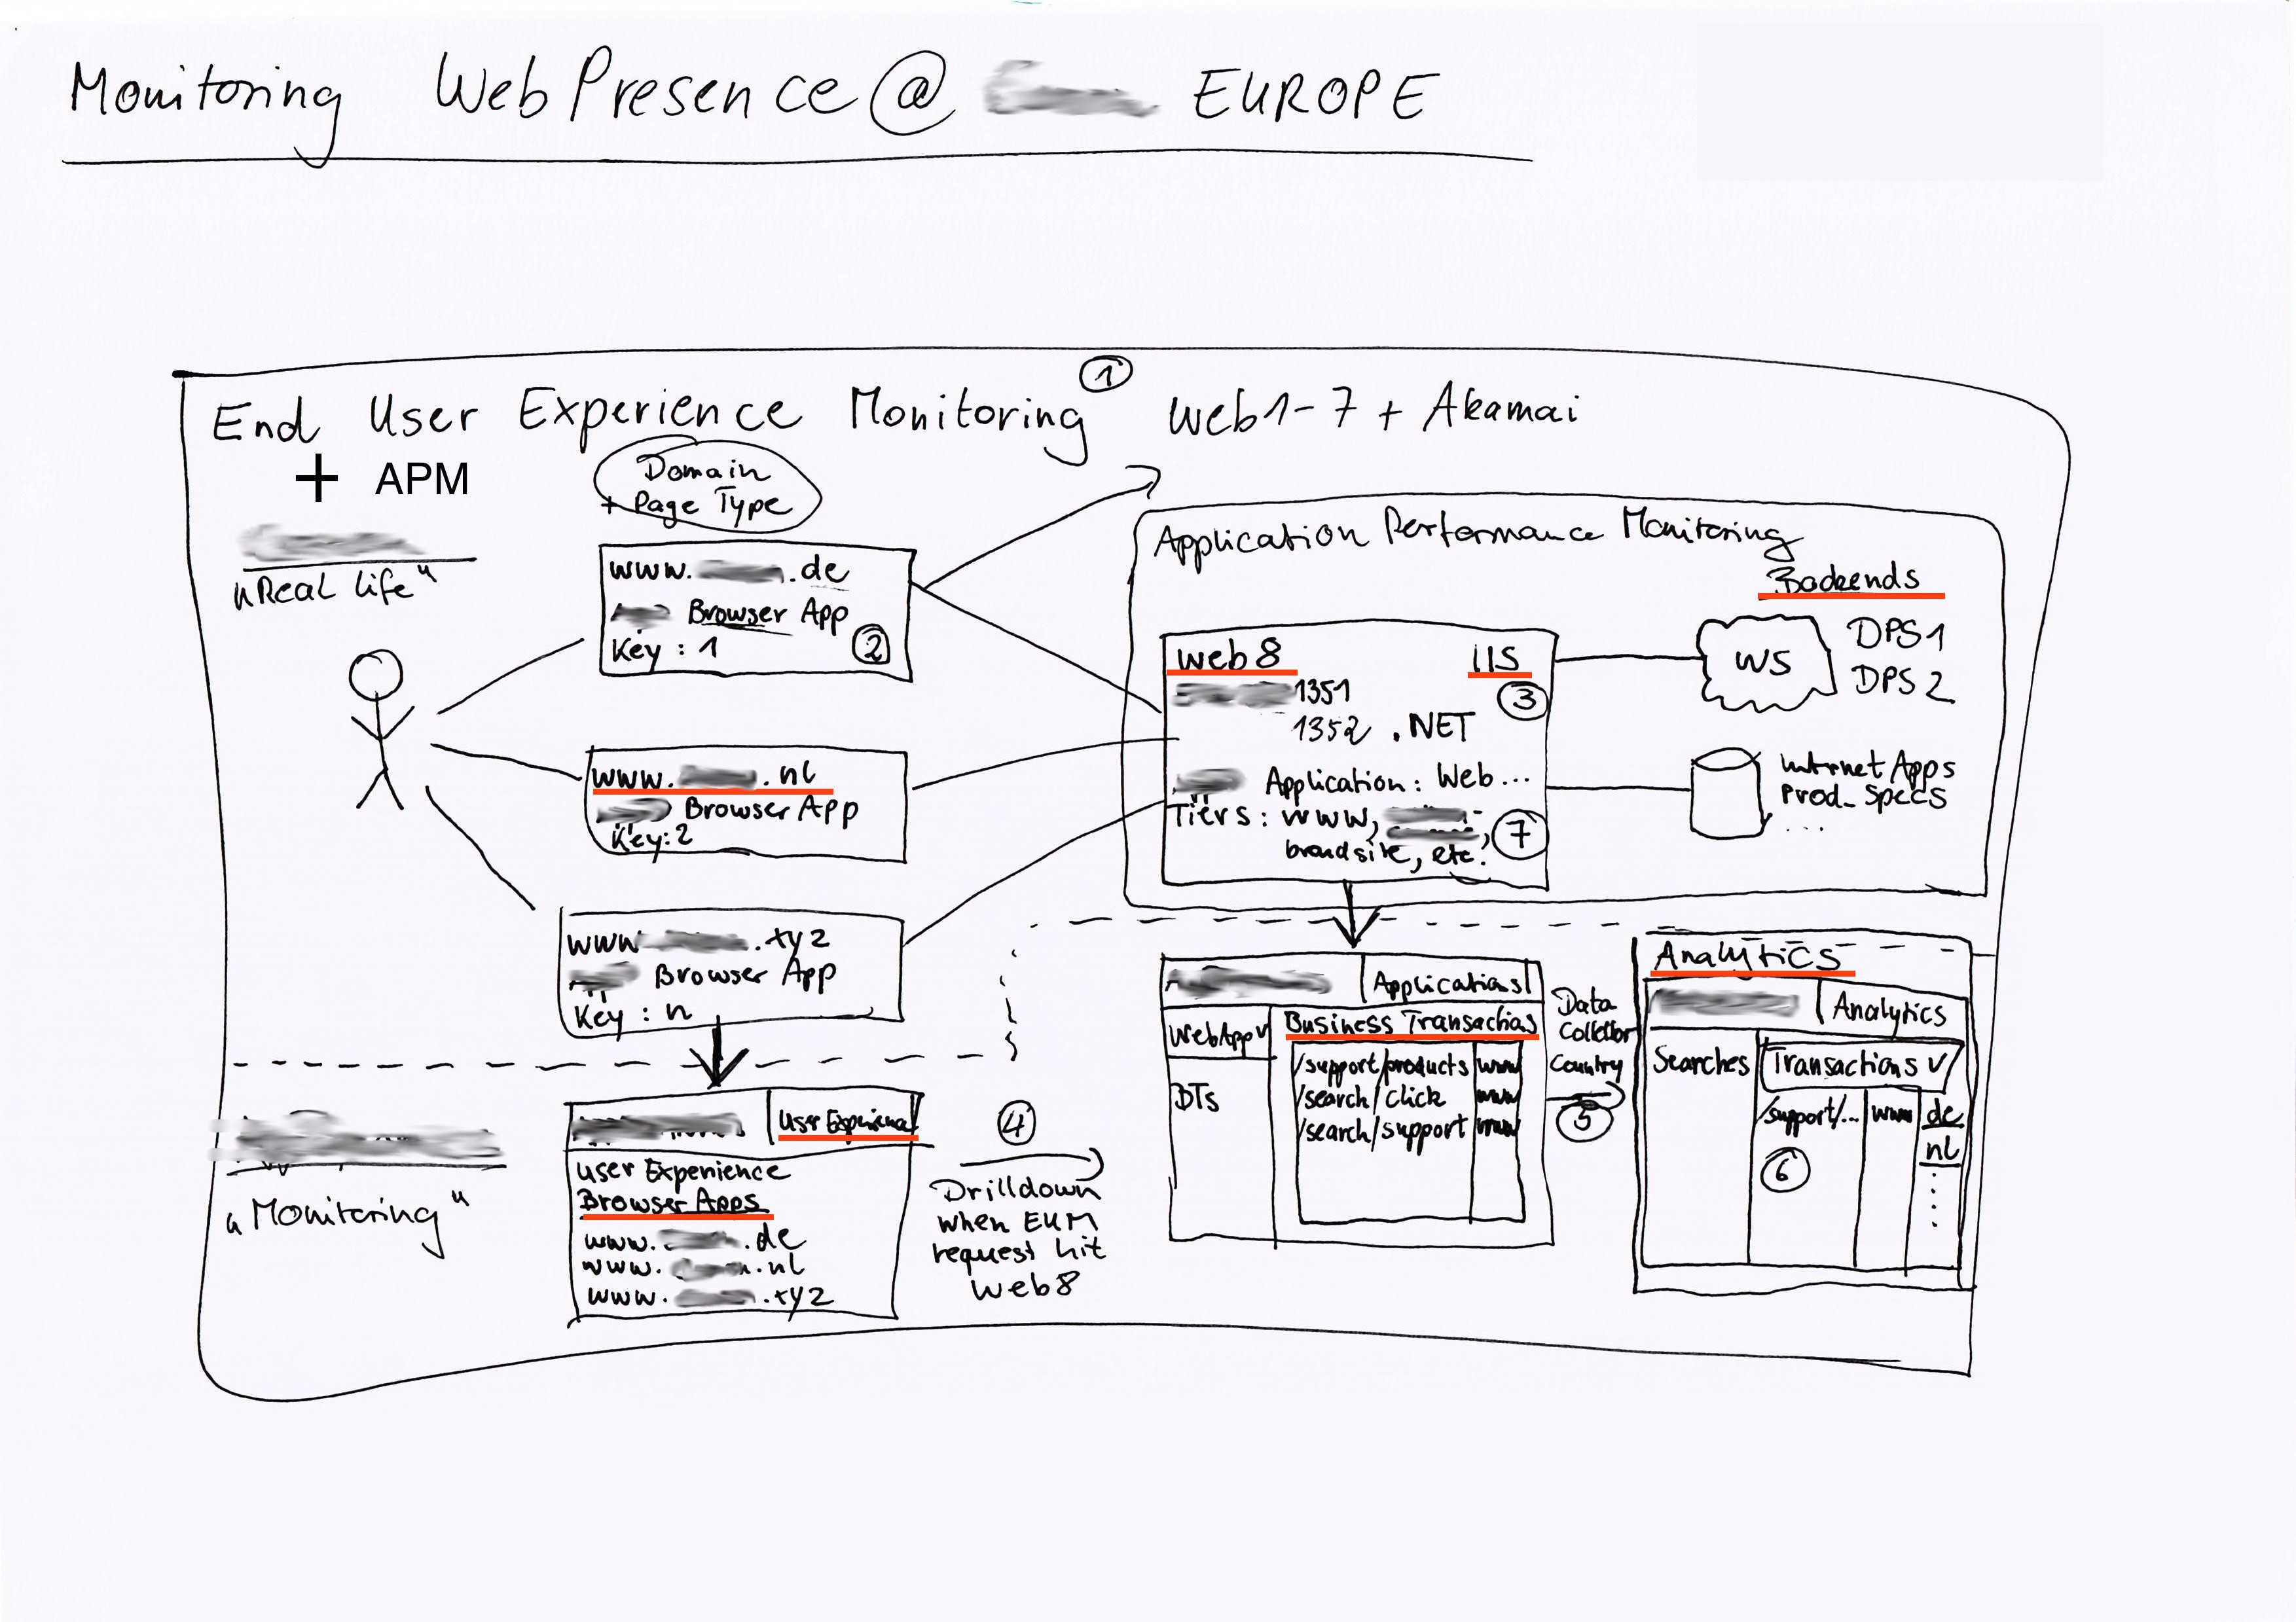
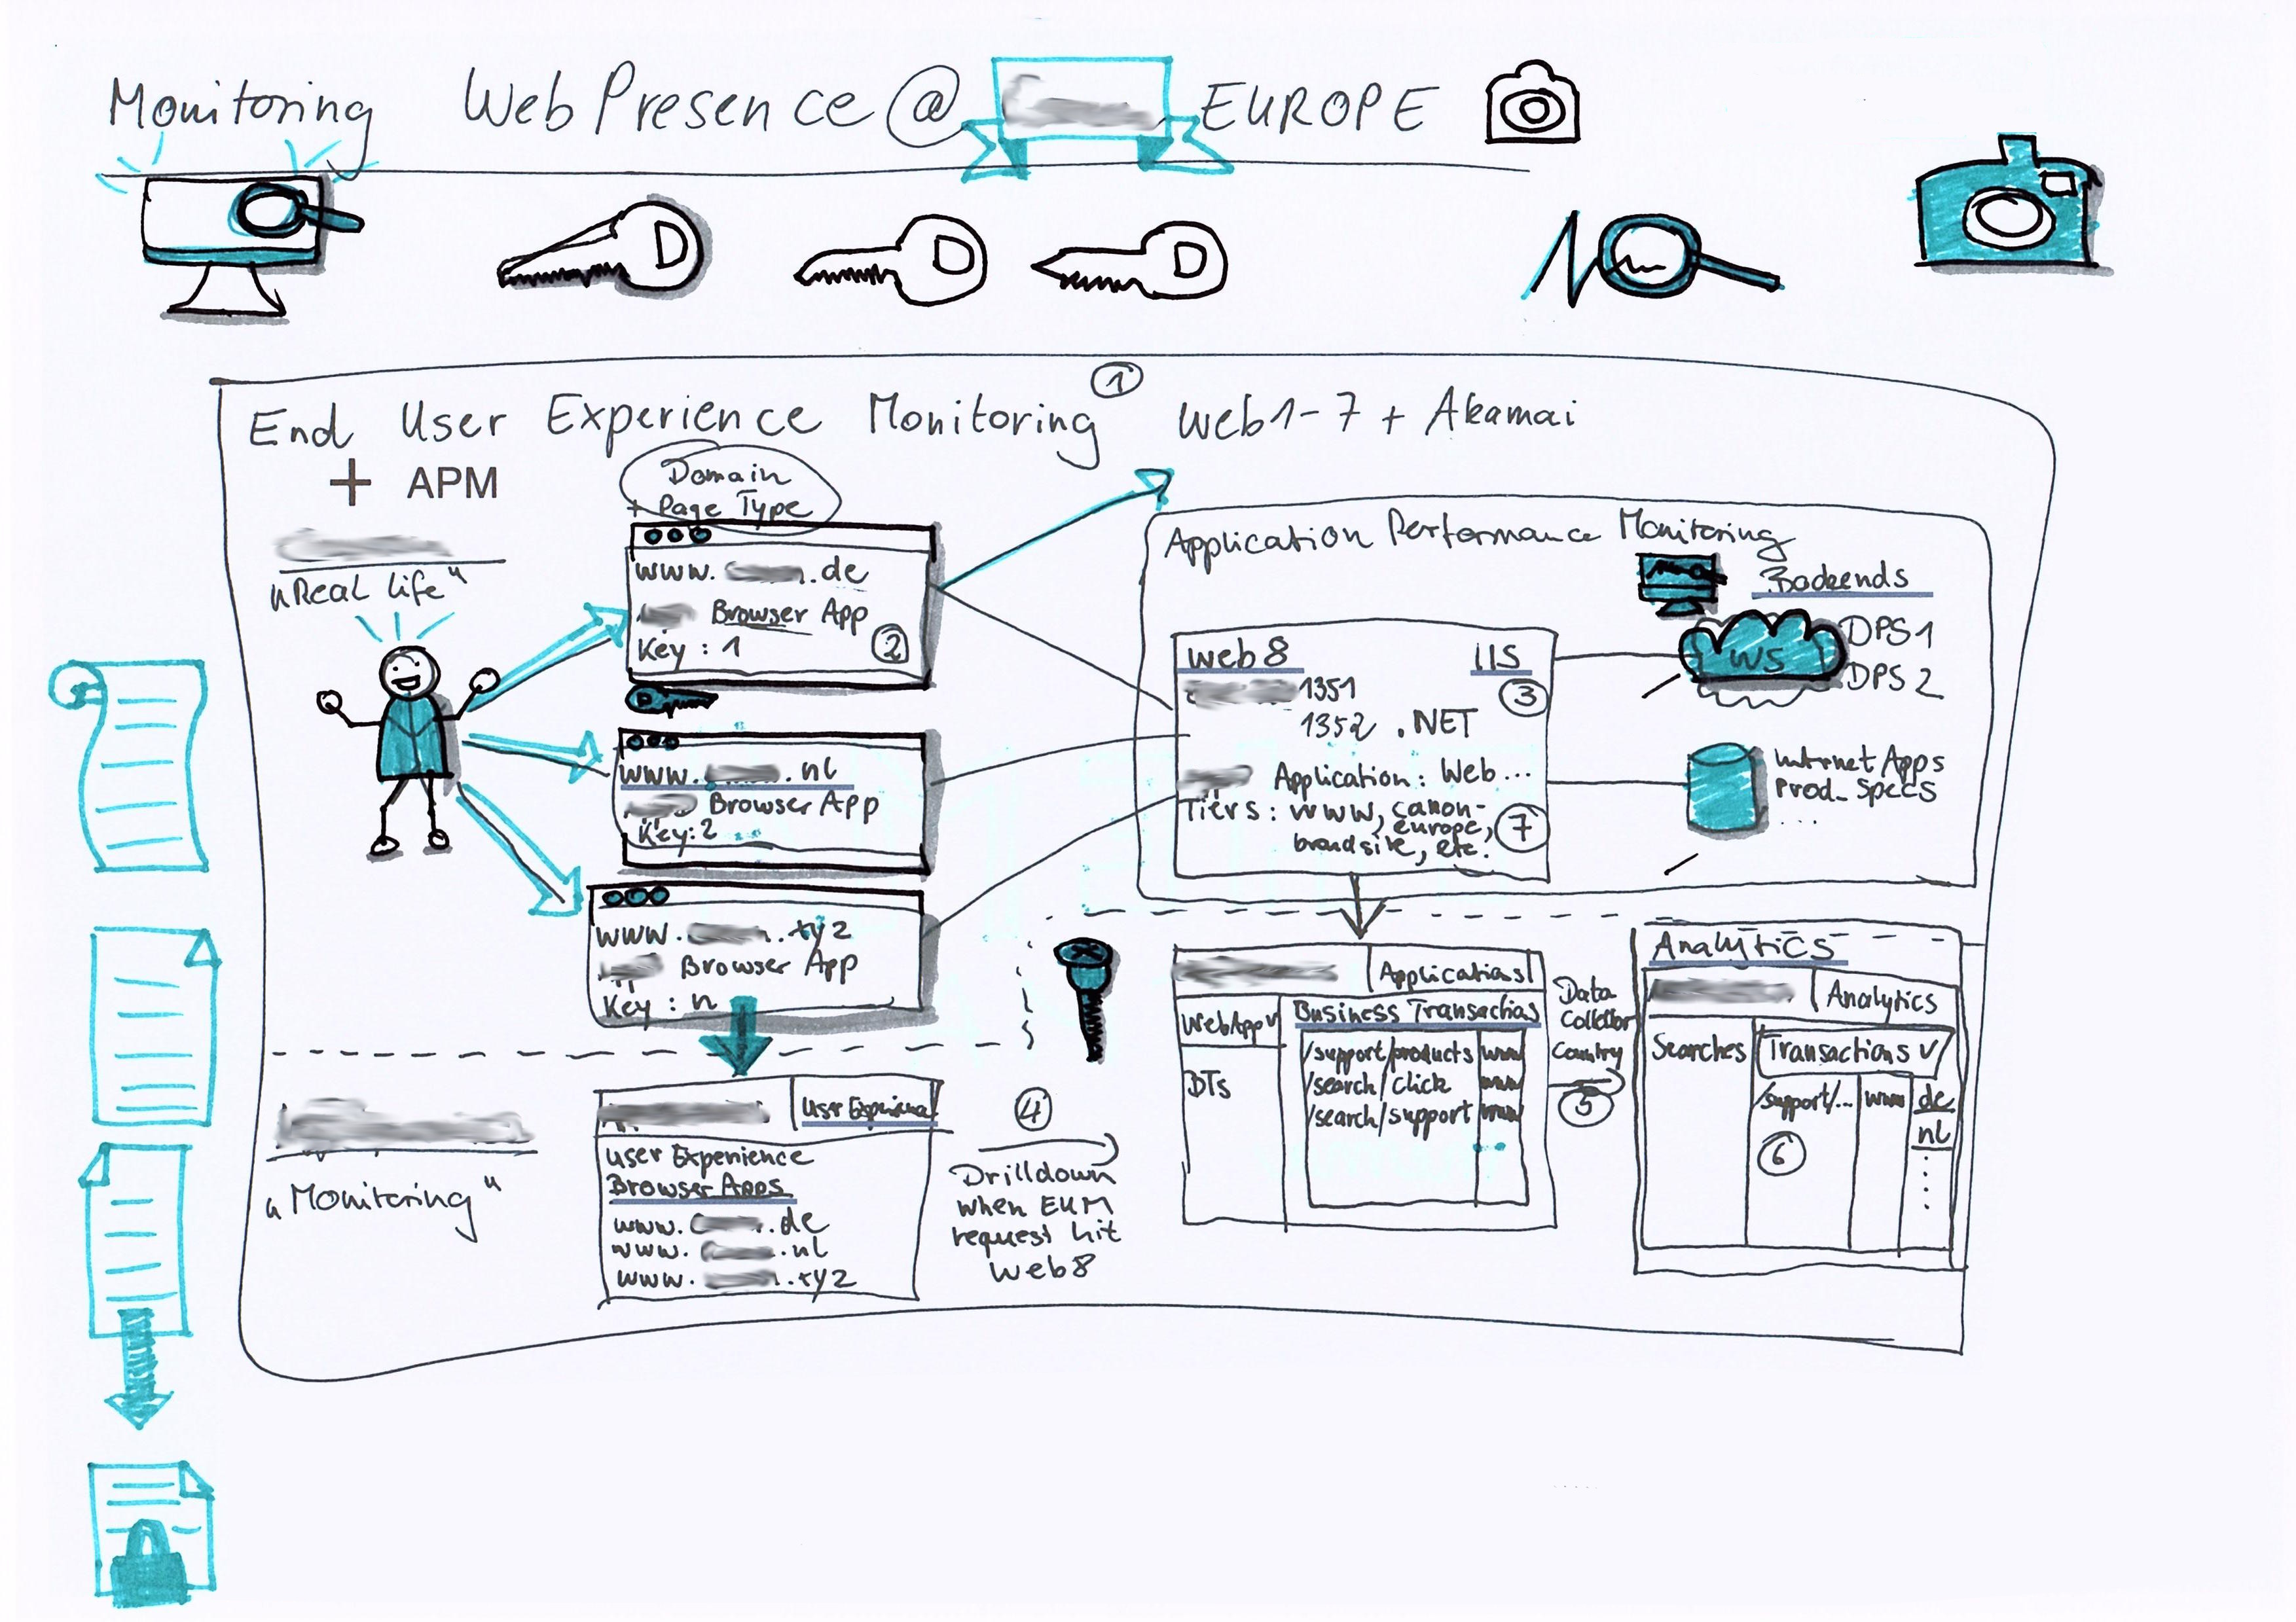
While working with clients (as part of my job at AppDynamics) I often find myself required to explain certain concepts or functionality of our product but explaining just using words often does not seem to be sufficient. This happened again lately while being with a client in Amsterdam so I thought about an alternate way of explaining things and decided to make a drawing. The following picture resulted from this and it shows the monitoring solution I had planned for this client involving elements from APM as well as EUM.
While I was quite pleased with my diagram there was obviously room for improvement. Luckily I am friends with Sketchnotemafia, so a few weeks later I had a good session with Friederike on how to improve my graphical skills.
There are three aspects we looked at for improving my diagram, which would eventually turn it into something closer to sketch art.
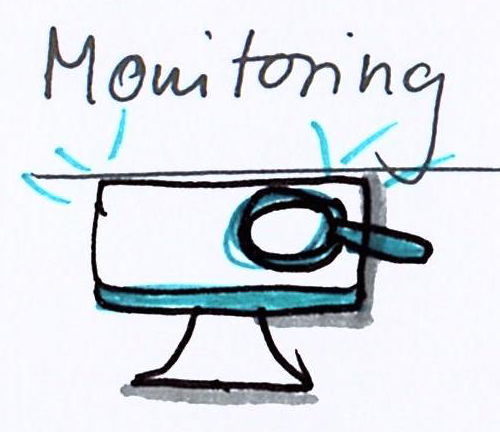
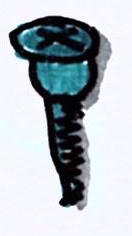
Firstly we searched for key terms that I would use in the diagram and replace these with icons. Key terms we found good graphical representations for are „monitoring“ as well as „drilldown“. Please see the following two screenshots showing what we came up with.
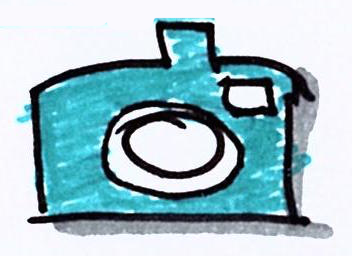
From now onwards I would use these icons instead of the actual words. Another good use case for icons would be to represent the client’s business. We did that by drawing a camera as shown in the following screenshot. Although the client’s business is not only about cameras anymore it certainly had been when they started out.
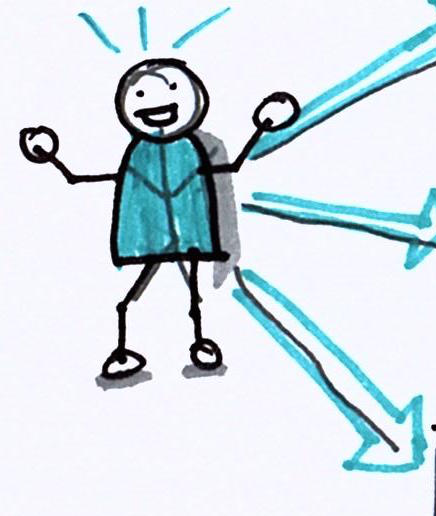
Secondly we spent some time drawing something that would represent the user. In my initial diagram I already had the user shown by a stick figure. We did not really change that but improved the appearance of the figure quite a bit. Besides giving it a proper upper body we also worked on the arms and legs by simply breaking up one line (e.g. representing an arm) into two lines, which would be connected by a dot. We also had a quick look at how to show emotion on the user’s face, however it felt that mastering this skill will actually require some more time and practice.
Thirdly to give the diagram a final polish we added flat grey lines on the right side and underneath of the icons and elements of the diagram to generate a shade like effect, which overall makes the diagram much deeper. Putting everything from above together is shown in the next screenshot. I am very happy with the results.
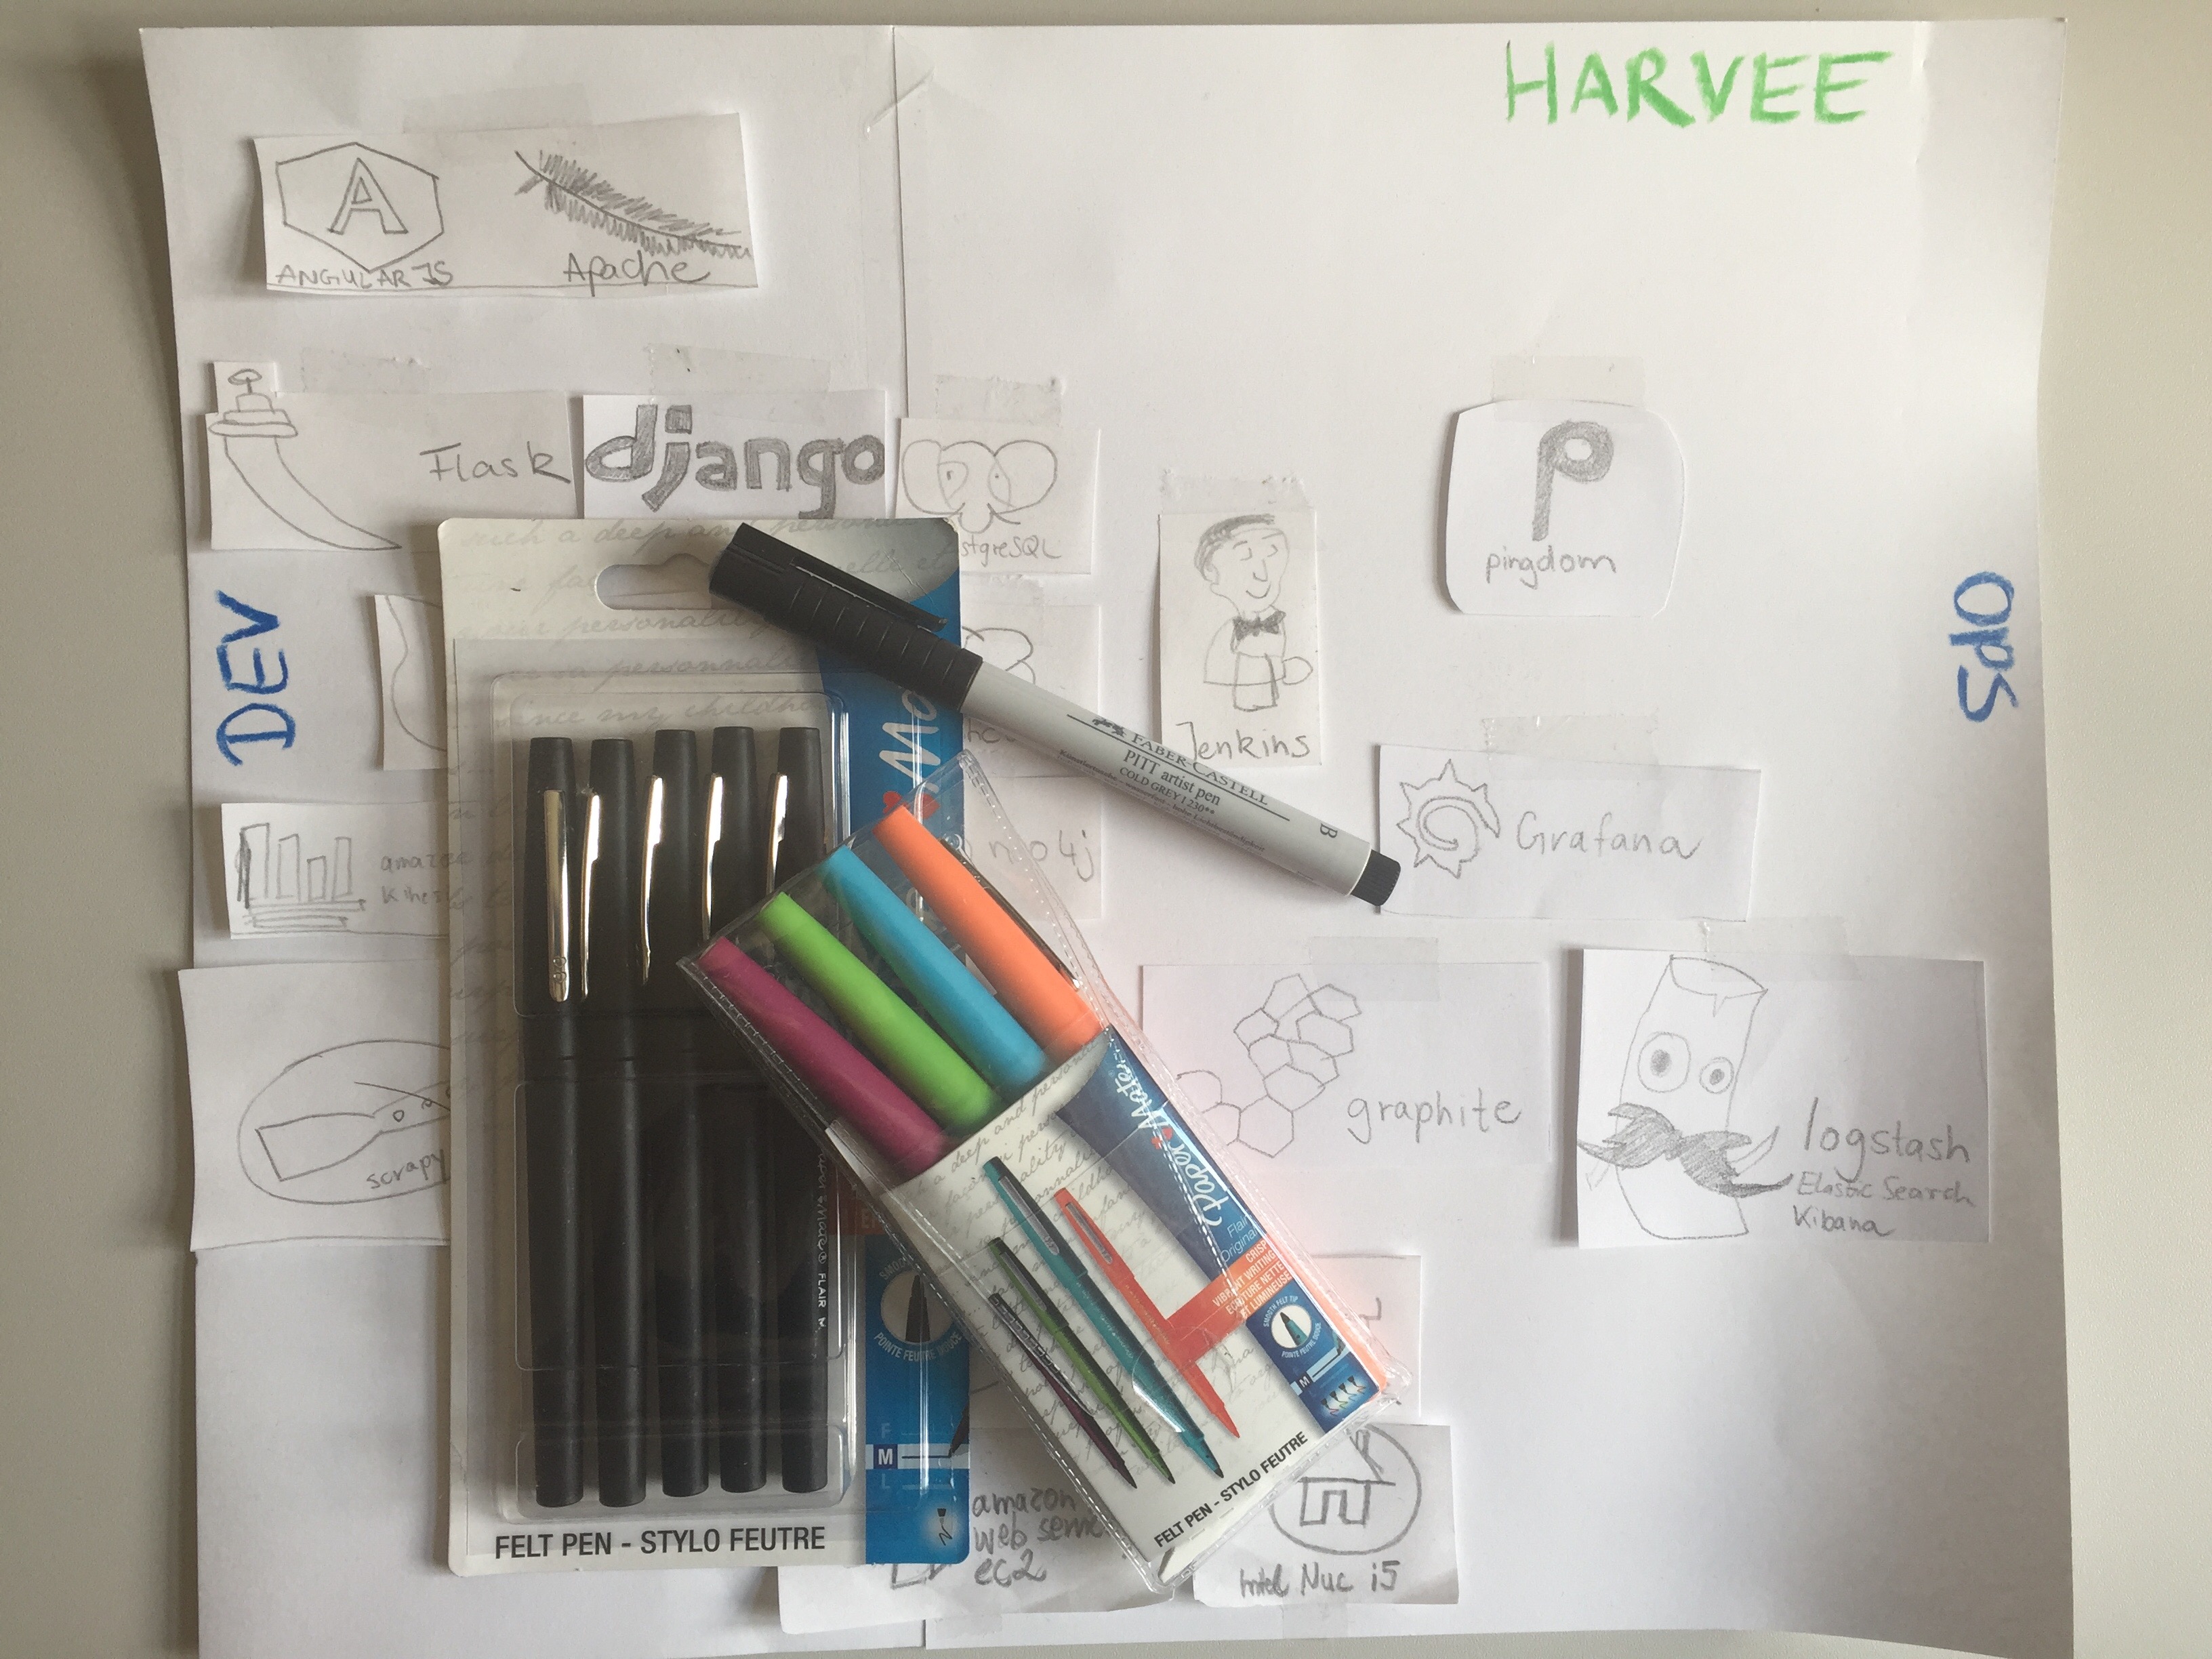
Through the exercise I also learned about the right tools aka pens for doing sketch art. I will keep you updated on my progress.